Showing posts with label Financial Markets. Show all posts

January 21, 2017

Indian Equities: Invest in “Quality” but….


While globally the trend is clearly in favour of ETF’s or passive investing, emerging markets like India still offers plenty of scope for stock selection and active management.  Investors can take a cue from bellwether indexes like Nifty 50 or Sensex and develop strategies around them to gain alpha. In this context, the recently launched index by National Stock Exchange (NSE) 2015 attracted my attention. . It is titled as “Nifty 30 Quality Index” comprising 30 best Indian companies evaluated across three important parameters i.e., Return on Equity (RoE), Debt to Equity ratio (D/E) and Net Income growth. It is normally understood that highly profitable companies with low levels of debt perform well over time compared to medium to low profitable business with high leverage. True to this logic, the Nifty quality index returned 16% annualized during the last three years compared to 13% for Nifty 50. Definitely some alpha here for chasing quality.

While index investing is a good idea for lay investors, professional investors can do more in terms of deciphering some strategy around these indices. Any index is always a combination of great, good and poor stocks. Buying the index (in the form of ETF) means not only buying great and good but also poor stocks. This article attempts to improvise the quality index by focussing only on great stocks and see if we can perform better than the index.

The 30 companies in the quality index can be broken down into three groups viz., , great, good and poor based on their stock performance since the launch of the index.


While great group are super performers, the good group eked out decent performance while poor group actually performed poorly true to their name. The poor group pulled down the overall performance of the quality index as they enjoyed higher share of the index by virtue of their size. Here is the summary of the three groups:

 April, 2013 to September, 2016
Great
Good
Poor
Total
No of stocks
14
9
7
30
Market cap weight (%)
33
31
36
100%
Average. RoE ( %)
28
45
27
33
Average D/E ( %)
44
10
2
18
Annualized Net Income growth (i%)
27
2
0
7.4


Portfolio Performance
34%
17%
8%
16%

Dissecting the 30 companies constituting the quality index, we can see that 14 of them are star performers, 9 good and 7 companies draggers with more or less equally divided weights among themselves. It is interesting to note that all three groups enjoy high return on equity. However, the great group has the highest debt to equity ratio while the poor group has the lowest. However, the key among the metrics is the net income growth. The great group show a robust net income growth of 27% annualized while the good group show only 2% growth. Worse, the poor group show 0% growth. If you carve out these three groups as distinct portfolios, the great group portfolio returned an astounding performance of 34% annualized, the good group 17% (equivalent to the quality index performance) while the poor group returned only 8% severely underperforming the overall quality index.


In each of these groups there are surprising entries as well. For eg., in the great group we have companies like Emami and Tata Motors recording negative income growth but stellar stock price performance. The poor net income growth can be attributed to latest quarters and hence they may be penalized going forward. In the good group category, Tech Mahindra enjoys high RoE, low D/E and high NI growth but performed average relative to index which is surprising. In the poor group, we don’t see any surprises as all of them report poor net income growth.

Caveat: This analysis looks at the past performance and extrapolates into the future. There is a good possibility that companies in the great group can drop down to good or poor and vice-versa. Hence, it behoves to revisit this strategy annually to make changes to portfolio.

PS: The author thanks Rajesh Dheenathayalan for data assistance

June 19, 2016

FINANCIAL CHALLENGES FOR GCC

This Article was originally written for CFA Institute and published in several newspapers including Gulf News and Arab Times

The GCC is witnessing a period of rapid transformation as oil prices, which were once at a cushy $100 per barrel, has fallen below $50 over the past 18 months. The stable oil prices between 2012 and 2014 enabled GCC to earn more than $3 trillion in export revenues. Thanks to that, GCC governments are now sitting on strong cash reserves.

However, that is only a short-term comfort. Given the extremely high dependence on oil revenues of GCC governments and their lack of economic diversification, the depletion rate of those precious reserves has been highlighted as a major cause for concern. GCC countries now require the oil price to be much higher than $50 in order to balance their budgets. Since prices are still significantly lower than that rate, the region’s governments will face successive years of fiscal and current account deficits; which they will have to plug through additional reserve depletion or through borrowings. Given this context, I would like to specifically look at the financial challenges this period of low oil prices will pose to four specific stakeholders: Government, Banks, Corporates and Individuals.


Government

The biggest pressure is on governments, who face a bloated bureaucratic structure and increasing levels of expenditure largely comprising of salaries and subsidies. Therefore, there is little flexibility for them due to the current social welfare model and the strong social contract with nationals. While rationalising subsidies and reducing wasteful expenditure can be prioritised, this may not reduce deficits within the urgent time frame that is required. Hence, the biggest financial challenge for GCC governments will be funding growing deficits. The IMF estimates GCC countries to pose a fiscal deficit of about 12% of GDP or $150 billion in 2016. I expect this to be met through a judicious combination of reserves, local debt and foreign debt. Research estimates by Marmore point to the cumulative debt increasing from $250 billion to $390 billion by 2020, a significant jump from $72 billion raised cumulatively between 2008-2014. Such a massive growth in debt raising is bound to have an impact on the overall economy in multiple ways. Saudi Arabia, for the first time in eight, had to secure a loan of approximately $26 billion from domestic banks in 2015. It is also in talks to raise $10 billion from a consortium of international banks in an effort to address their growing budget deficit. Most notably the credit rating will be lowered as a consequence of the increasing Debt to GDP ratio. Sovereign ratings of Bahrain, Oman and Saudi Arabia have already been downgraded recently with further downgrades expected in the future. Another point of impact will be the Credit Default Swap (CDS) spreads. In the last six months, CDS spreads of Abu Dhabi, Qatar and Bahrain have doubled while Saudi Arabia’s has tripled. The current macroeconomic conditions will also increase the cost of capital for governments.

Banks

The financial challenge for banks will come in the form of lower levels of liquidity. Banks, to a great extent, largely depend on government deposits for their liquidity; which have experienced significant decreases. With stagnating growth in deposits, banks will have lesser amounts to lend at a lower spread; which will have a negative impact on their profitability. On the other hand, the sovereign bond issuances will see high levels of subscription by banks because of the attractive yields and their risk free nature; this will crowd out lending to the private sector. The pressure this will introduce to the margins of banks will result in lower profitability. Additionally, the financial challenges for corporates will mean deteriorating asset quality and a rise in Non-Performing Assets. As a result, the credit rating for banks will remain on the downward trajectory.

Corporates

Banks being crowded out will directly impact the private sector, since fund raising will be increasingly difficult and expensive. Many companies have solely depended on government spending for projects. In this climate, project delays are inevitable and may affect working capital. Advance payments for projects have been slashed from 20% to 5% of contract value. Since corporates access banks for most of their short-to-medium funding requirements, access to funding may become difficult and expensive given the pressures banks face resulting from lower liquidity and tighter margins. Debt markets may be an attractive source of funding for governments but not for the corporate sector due to wider spreads demanded by lenders. We have already noticed a weak corporate issuance of debt due to the drying up of liquidity. Where funding is absolutely necessary, it will come at higher cost of capital which adds additional pressurise on margins and profits. Introduction of VAT may also impact corporate profitability. These developments will have a substantial impact on Small and Medium Enterprises (SME’s); who will be crowded out the most.

Individuals

Financial challenges for individuals will come in different forms. Firstly, the generous government policies in the form of subsidies will see cuts; especially for the three most highly subsidised amenities which are petrol, water and electricity. As subsidies are reduced, the cost of services will increase and lead to higher inflation. Individuals will also have less access to financing options from Banks as lending procedures are tightened. Simultaneously, borrowing costs will also increase. Such market conditions may lead to increased debt defaults. Also, governments employ a majority of citizens in the public sector more as a social contract rather than genuine need. The absorption rate will come down as a consequence of growing federal deficits.

Opportunities

As many experts say, challenges can also be viewed as opportunities. Increasing government debt will induce financial discipline, better management of fiscal expenditure and more importantly, the much needed development of debt markets and improvement of the yield curve. Efforts to reduce wasteful expenditure will improve productivity levels across sectors and banks will look for overseas expansion opportunities to improve profitability. The current economic conditions will also encourage the adoption of advanced technological products and services to reduce the cost of service offerings. Corporates will focus heavily on efficiency and productivity gains and align corporate planning with thoroughly researched market needs. Mergers and Acquisitions will be on the rise along with alternative financing avenues such as private equity, crowd funding and sukuks. It will be a period of financial reform to navigate through this challenging period for both the government and private sector!

February 22, 2016

Mistakes I Made As An Investor


Human psychology is a powerful force and spoiler, especially in investing. We tend to glorify our successes and ignore mistakes or best give it a passing reference in coffee tables. Stock market investing is treacherous and requires strategy and monitoring. Even if your strategy is subpar, a good monitoring system can save the day. On the other hand, a great strategy with subpar monitoring can be disastrous.
So long as we earn money, we are savers and investors. Hence, it may be worthwhile to recount some of the mistakes I have done while handling my savings, especially in stock markets. Let us see what those mistakes are.

1.   Not having Endurance
Markets are by nature volatile and hence make your emotions swing. It is normal to get upbeat in a bull market (and laud your expertise) and disheartened in a bear market (and curse bad time and luck). However, what is critical is your endurance during the down market where your emotions are tested to the hilt. I remember buying some of what is called today as blue chips way back in 1990’s when I stepped into a career. If only I had the endurance to have held them today, I could have retired a while ago! Instead, I gave into the market psychology of selling when everyone was selling. Sometimes, your investments go nowhere though they are not producing any losses. They can test your patience since you will have the urge to compare them with broader market or with other stocks. Stock price appreciation can never be a straight line. Many stocks have a long time period of flat performance and then a takeoff (what I call as inflection point). But the point is we cannot predict when that take off will happen. Since we cannot predict this, we sometimes lose interest and exit the 
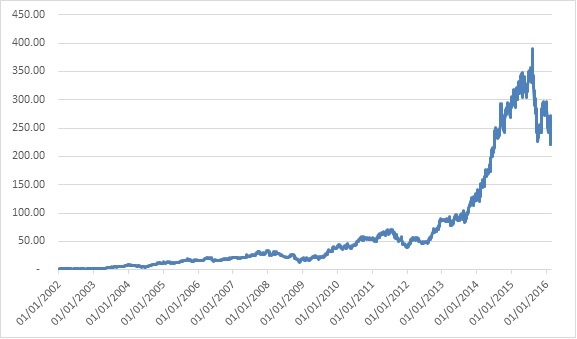
investment. That can prove costly as well. Here is an example of Eicher Motors. Notice the long stretch of flat stock prices (2001 to 2009) hovering between Rs.24 and Rs.400, and then a sudden burst of performance taking the stock price all the way up to Rs.21,000 within a short span of time. If you were holding this stock since 2001, it would have really tested your patience!


2.   Going by the Herd Mentality
Identifying investment opportunities is a time consuming and lonely work. It requires validation from several fronts including financial analysis, qualitative analysis and connecting all the dots that are strewn all over the place. Even then, one cannot be sure about the future prospects as on the date of investing. However, there is an easy way of doing all this. Just go by what your friends/colleagues/relatives are doing or what your brokers recommend. If they are buying ITC, so buy it. If markets are going up, keep buying when the trend is positive regardless of whether valuations are reasonable. This is a sure recipe for underperformance. I used to compile the top holdings of all the leading fund managers to see where they are investing in order to mimic their investments only to realize that such a strategy is very similar to herd mentality which the fund managers themselves are suffering from!

3.   Mistaking name/brand for profits
The key indices (like Sensex and Nifty) are always dominated by large caps. By definition, most of them would be market leaders in their respective industry (Bajaj Auto, Infosys, Reliance, HDFC, ITC to name a few). Market leaders are big brand owners. But being big and owning sexy brands do not equate to good performance all the time. Sometimes, it is the small seemingly boring businesses without any recognizable brand power that can create enormous shareholder wealth, which is what we are concerned. Also, once a company becomes large cap and brand leader, it may unnecessarily spend loads of money to keep that status which can be a big negative for shareholders. No wonder, many of the large caps in the index have poor performance track record during the last 5/10 years in terms of creating shareholder wealth.

4.   Not acting when I should Have
It is said that the easiest thing in the stock market is to buy and the toughest is to sell. You will be forced to take a sell decision under three scenarios i.e., when you made good money and wondering if you want to take some profits, when you have lost significantly and wondering if you should cut further losses or when you have a liquidity need where you are forced to sell regardless of the situation. The first is a good problem to have and the third is a bad problem to have. However, the trickiest part is the second. This is where psychology comes and acts as a spoiler. When your investment is down, your psyche refuses to accept it as you feel you have grossly erred in your judgment. And also, there is this innate feeling that this is temporary and the value will come back. This feeling need not be backed by any logic. It can just be a feeling. Also, you have a reference point i.e., your purchase price and your psychology is swayed by this reference point. Unfortunately, the market does not know or does not care what your reference point is. Hence, once the investment goes down in value, it need not come back (as you innately feel). Rather it can go down even further. I remember being caught in one such investment cycle where I invested in a gulf stock called Gulf Finance House (GFH). Relative to my investment value, my realized loss on that investment was 98%!. A classic example of not acting when I should have.

5.   Averaging on the Downside
This probably counts as a very common reaction when your investment value is down. When the stock price tumbles, instead of fearing further downside our instincts let us think that “if it was attractive at the earlier level when I bought, it should be even more attractive now, so let me buy more”. Again the spoiler in this situation is the reference point, which is your initial purchase price. Your reference point has no reference value for the market and hence averaging down on the downside can only result in “throwing good money after bad”. Since markets are volatile, bounce backs are common and can make you feel that you let a great opportunity to average your purchase price when the bounce back happens. However, if price bounces back it will also make your investment look good and hence should be of less worry. But if your averaging down does not pay off, the net loss on that investment will be manifold. Hence, the need to wait for the right price to buy stocks so that we are not caught in this dilemma of “double down”! I am appending a table to illustrate this effect. During the last one year, Nifty has been doing poorly so much so that out of 50 stocks in Nifty 43 of them are in negative territory. All these 43 companies are ripe for “averaging down” concept. The worst performer in Nifty during the last one year was BHEL with a 61% fall in share price. The stock price plummeted from Rs.270 to about Rs.100 now. Any averaging along this path could have produced endless pain. The same can be observed with other indices of NSE as well.


   6.   Not being affected by loss on profits
Not all losses are same. A loss of capital can produce more pain relative to say loss in profits. Hence, complacency to deal with losses in the second case. We panic the moment we have a loss of capital. But we do not show the same panic when our profits  are reduced though in theory a loss is a loss. At least, that is how I dealt with my losses worrying the most in cases where the capital is negative and not worrying about those where it is a loss in profit situation. The best way to deal with this problem is to equate your year-end market value to 100 and look at the appreciation/depreciation from that perspective. Appended is a table with some hypothetical numbers to explain the concept. If your investment starts at 100 and in a 5-year horizon touches a peak of 150 and reverts back to 100, your compounded annual growth rate (CAGR) will be 0 with no negative performance highlighted in the interim 5 years. Since you don’t see any negative performance, you may turn complacent to loss in profits. However, if you equated the year end value to 100 every year, years 3,4,and 5 would have highlighted negative performance. Such a performance highlight could either have enabled you to take the profits or do something else other than stare the stagnant performance.


7.   Not Insuring the portfolio
Insurance need not be restricted to just life, cars and bikes. Even your stock portfolio requires insurance lest you run the risk of swinging along with the market. Like life insurance or other insurance products, portfolio insurance also will cost you money. But that cost is bearable given the downside protection it offers during sharp market downturns. Simple portfolio insurance example is to buy put options. Fortunately Indian markets now offer such portfolio insurance products. Even where you have investments only in mutual funds or ETF’s (for some reason many think they are safe investments!), you still need to insure your investment as your fund manager will not do it for you.

8.   Mistaking performance for stability
When a stock performs well on the back of good company performance, we can mistake it for stability and hence may fail to check the story at regular intervals. Turning points, even in a good scenario, can be sudden and can wipe out gains in no time. A recent example is Motherson Sumi, an auto ancillary company. Like Eicher, the company had a long streak of ordinary performance and then had a nice takeoff. From Rs.88 in Sept 2013, the stock went up to Rs.348 in August 2015. Not many paid attention to its over dependence on Volkswagen (40%) and when bad news came in the form of scandal involving VW, the stock price of Motherson Sumi plummeted 42% in just two months!


9.   Mistaking Performance for Skill
The biggest mistake you can make as an investor is to attribute success to your skill and failure to luck! (or bad luck!).  The performance of a company and therefore its stock price is dependent on scores of quantitative and qualitative factors. While through skill you may be able to crack the quantitative part, it is a time-consuming and innate exercise to look through a company qualitatively. Qualitative factors include a deep understanding of the Board and executive management, their track record in terms of corporate governance, ethical conduct of the company and its owners, employee remuneration, tweaking books to show a certain performance number, political connections, front running the stock, insider trading, etc. Either you devote a considerable time unlocking these essential elements to develop the needed conviction or go with a gut feel on the subject. Given our inability to find time, we normally resort to the second tactics. When your decision turns positive, you feel you are in control of this process. Always double check the story during a good performance period just to be sure you can keep the profits.

Honestly I have been through all these mistakes in one form or other. This list of mistakes may not be exhaustive and I may unravel many more as I reflect. 


May 08, 2014

MODERNISING GCC CAPITAL MARKETS: 5 IMPORTANT STEPS

This article was originally published iArab TimesAl Qabas, Gulf News and Akhbar Al-Khaleej


While the GCC countries generally enjoy a high standard of living and prosperity, they are still behind the curve when it comes to its capital markets. The definition of capital markets predominantly means equity markets primarily in this region due to the lesser role played by the debt market. Notwithstanding, there is an immediate need to modernize the GCC capital markets in a way that it can deliver its true function –efficient capital allocation.

While there are myriad factors that can contribute to these modernization efforts, the five most important factors are:

  1.       Integrate the Markets: GCC stock markets, like GCC states, are not a homogenous group. With Saudi Arabia’s market cap pegged at over $500 billion and that of Oman pegged at $18 billion, the comparison is never apples to apples.

Several efforts to unify GCC on many fronts including customs, currency, etc. achieved only partial success if primarily due to political differences. In spite of this, unifying the capital markets and creating one stock exchange representing all GCC markets that trades both equities and debt can be a great step towards modernizing. This will obviate the need to reinvent many things including state-of-art technology needed for a modernized stock market.

A unified GCC stock market can be worth more than $1 trillion in market cap and can list nearly 700 stocks, making foreign investors take a serious note of this region.

  2.       Institutionalize the markets: The major worry about GCC stock markets is the lack of institutional investors and therefore predominant presence of retail investors. The domination of retail investors is not bad per se, but the absence of credible long-term institutional investors is a serious worry.

While institutional investors provide the much needed stability and liquidity to the markets and can significantly deepen the market, they are presently quite under represented. Such institutional investors include sovereign wealth funds, mutual funds, pension funds, hedge funds, foreign institutional investors, insurance firms etc.

Attracting institutions to the market cannot happen through a decree. However, regulators and policy planners can take proactive steps in strengthening market microstructure in a way it can start appealing to institutional investors. Restrictions like foreign investment can be a big negative towards this process. Requiring market participants to adopt sound corporate governance codes can be a big positive.

 3.       Strengthen Information Base: A critical missing link here is the ability to obtain stock market related information from websites.

A diligent investor should sift through several pages (in English and Arabic) in order to even assemble some meaningful basic information about listed companies and markets. Technology can assist in this effort to seamlessly provide information across companies, sectors, family groups, etc., and this initiative can be taken by the respective stock exchanges. 

  4.       Improve Liquidity: The main casualty of the global financial crisis has been the stock market liquidity for GCC markets.

After hitting a peak of $1.6 trillion in 2006, value traded for GCC stock markets hit a low of $296 billion in 2010. At the end of 2013, total value traded was placed at $475 billion. It may be a long time before GCC stock markets return to the volumes of 2006. Even extrapolating IMF forecast for GDP and its linkage to market cap, the turnover value is expected to touch $875 billion by 2019, still a far cry from the peak of 2006. Liquidity is a key dimension for the survival and growth of the brokerage industry and can be a key input for foreign investment. It is also an important factor for including GCC markets in global indices like the MSCI Emerging market index. Presently UAE and Qatar have managed to enter this prestigious club but notable absentees still include Saudi Arabia and Kuwait. 

  5.       Provide more tools for Risk Management: GCC stock markets are inherently more volatile than their emerging market peers primarily due to their nascent stage of development. Hence, managing this risk or volatility is a key underpinning for institutional investor entry. A buy and hold environment may not enable this.

Availability of broader tools like derivatives (options and futures) can provide the needed tools for managing this volatility. Derivatives are often viewed with trepidation in the region primarily because of its debilitating effect in the Global Financial Crisis. However, a good tool in the hands of a bad person does not make the tool bad. Proper checks and balances can make this serve the original purpose for which it is invented – to hedge risk and protect downside. 

  Modernizing GCC capital markets can lead to several improvements that can be tangibly measured, including:

  ·         Increasing the role of capital market in the overall economy as measured by the market capitalization to GDP ratio. Currently it stands at 58% while many countries in the world enjoy a ratio of over 100%.
  ·         Enabling GCC markets to find a place in the MSCI Emerging Market index. Presently only UAE and Qatar have this coveted status.
  ·         Increasing the foreign institutional investment especially long-term investors like pension funds and endowments.
  ·         Improving the new listings, which is at the core of market development.

All of these results are measurable. Can we then think of making these the Key Performance Indicators (KPIs) for our regulators and policy planners? 


May 01, 2014

The Debilitating effect of Inflation on Investments

This article was published in The May 2014 issue of the Global Analyst

       ·      Rs. 1 lakh invested in Equities 25 years ago will now be worth Rs.47 lakhs before inflation and Rs. 7.6 lakhs after inflation!
·         Rs. 1 Lakh invested in Gold 15 years ago will now be worth Rs. 6.7 lakhs before inflation and Rs. 2.7 lakhs after inflation!
·         Rs. 1 Lakh invested in Fixed Deposits 10 years ago will now be worth Rs. 2 lakhs before inflation and Rs. 1 lakh after inflation!
·         What Rs. 6,700 could buy in 1980, you will now need Rs.1 lakh for the same!
    Almost always we make investment decisions based on absolute performance rather than inflation adjusted performance. In my humble opinion, this approach can have very costly consequences in terms of our wealth and overall financial well-being.
     Without considering the effect of inflation, the investment performance can look really dramatic. For eg., Rs. 1 lakh invested in 1979 in equities can now be worth Rs. 1.88 crores!. But when adjusted for inflation it is worth only Rs. 12.6 lakhs, still better than other investments like gold and fixed deposits. Also, inflation creates more havoc in the long run than in the short run as it is a steady and silent killer. For eg., if you have invested Rs. 1 lakh in a fixed deposit in 1979, it is now worth Rs. 15.5 lakhs. But when adjusted for inflation, it is worth only Rs. 1 lakh! In other words, for 34 long years your investment worth has remained unchanged.
Source: RBI, BSE, and other sources. All data for period ending 31st March 2013. 

     The table above reflects the complete picture across time and investment category. Let us analyse by investment category. At this stage, it may be worthwhile to explain what is nominal and real. Nominal rate of return is the absolute rate before adjusting it for inflation. Real rate of return is the performance after adjusting for inflation. For eg., during the last five years fixed deposits have returned an annualized return of 8% while inflation was also running at more or less same speed causing the real rate of return to be nil.

      
      Fixed Deposits

     If you are a fan of fixed deposits, think again. Most of us, deal with bank fixed deposits without realizing the meagre return (after inflation) that it offers. It has failed to produce any reasonable real rate of return in any time period. While banks have benefitted by the fixed deposits as they make nice spreads (the difference between lending rates and deposit rates), the investors have not made any returns since inflation eats away all the returns leaving nothing on the table. Whenever inflation increases in the economy, the RBI uses interest rates as a tool to contain the inflation (though I am not sure how effective that strategy is so far). In other words, when inflation increases, interest rates also increase thereby technically protecting the real rate of return. However, as data shows, inflation seems to have had the upper hand resulting in the dismal performance of fixed deposit. Over the long-run, a 0% real rate of return can hurt seriously. 
     
      Gold

    Your wife’s obsession with gold after all is not a bad idea! Gold has always produced good real rate of return across all time periods unlike fixed deposits. Gold seems to be having a gala time of late (during the last 5 years) compared to say last 25 years or 34 years. Gold has generated nearly 25% nominal returns annualized (before inflation) and 15% real return (after inflation) during the last five years making it as the best performing investment. It also had a nice run when seen from a ten year context with inflation adjusted annualized returns at nearly 11%. However, in the long run (25 years and 34 years), its real return (inflation adjusted) seems to be moderate but still better than fixed deposits.

    The recent good performance of gold in the last five years could be more due to global financial crisis and its aftermath all across the world. So long as global uncertainty persists, we can expect gold run to continue.


      Equities

      Indian Equities by far has the best story to narrate, especially in the medium to the long-term. In the short-term, (last 5 years), the equity performance is negative after adjusting for inflation but this is only expected given the volatility with which this asset class evolves in the short term. As said before, the global financial crisis has a direct bearing on the performance of equities and hence it is no surprise that its performance has been lack lustre. However, if you can muster some patience, it is by far the best hedge against inflation. It produced a real return of 8.5% annualized in the last 25 years compared to 1.7% for gold and 0.9% for fixed deposits. The same trend can be observed for the last 34 years where it produced a real return of 7.7% compared to 2.7% for gold and 0.1% for fixed deposits.

     It is thus clear that if we can have a time frame of 10 years+ then we can expect equities to protect us from the inflation beast. In the absence of treasury inflation protected securities (TIPS) as it exists in US, the only place to hide against inflation seems to be equities. Though there is no statistic to back the claim, I also feel Real estate doing a good job of protecting value against inflation.

      Welcome to the world of Finance!

     On a side note, while inflation is certainly not benefitting investors, it is benefiting insurance companies in terms of launching products. Recently Aviva launched “Family Income Builder” scheme which states as under:
    “You would be surprised to know that the cost of living has doubled in the last 12 years, and this trend is expected to continue. Are you sure that your savings are also growing at a similar pace? Presenting Aviva Family Income Builder - a life insurance plan that doubles your money. Pay an annual Premium for 12 years and get double of what you have paid every year, for the next 12 years, guaranteed”
    Simply put, what they are saying is that they will double your money in 12 years! A back of the envelop calculation says that the annualized return of such a proposition is just 6%, far lower than the fixed deposit returns that you get in banks! The catch is not in doubling, it’s how soon you double. Welcome to the world of finance!
   
     Trends and Challenges:
     There are 3 trends that are worth noting from a lifestyle point of view:
     ·        You will live longer than you think-more importantly your wife will live longer than you (based on life expectancy)
·         Your investment will produce lower returns as you age yielding lower income &
·         Your cost of living will increase more than what you estimate
      The power of inflation probably comes in directly in the last trend i.e., cost of living and to an extent in the second trend where after inflation the net returns will be lower. The final outcome of these 3 important trends is that you will experience a lower standard of living in retirement.

     
      How to beat it?
        ·         Focus on health-don’t just be content with maintenance. Spend money on building a healthier body.
·         Develop an investment strategy that is inflation proof (and fixed deposit is certainly not one of them)
·         Work longer-move your retirement age from 65 to say 70 or even 75


      The author thanks Karthik Ramesh and Rajesh Dheenathayalan for assistance. 

Why is Liquidity important?

Liquidity is at the backbone of any market development and GCC stock markets are no exception. Strong oil price backed wealth effect coupled with retail nature of the market triggering speculative activity contributed to very robust liquidity levels in the past, especially before the financial crisis. Liquidity is generally measured as total value traded and is expressed as a % of total market capitalization to arrive at the velocity. A high velocity may indicate that liquidity is running ahead of the market and vice versa. Also, improved liquidity has many benefits including cost of transaction. In the context of GCC stock markets, the following questions beg answers:
1. By how much did the liquidity drop for key index movers measured in terms of before and after Global Financial Crisis?
2. What impact such a drop had on the bid-ask spread (a proxy to measure transaction cost)
3. Are there any inconsistencies in this and if so what can explain it?
Before we answer these questions, let us quickly explain the methodology of this small research:
1. We collected daily volume, value traded, market capitalization, bid-ask spread on 15 heavy weights in the GCC stock markets
2. We organized this data in terms of pre financial crisis (before 2008) and post financial crisis (after 2008).
3. We calculated Average Daily Value Traded (ADVT), a measure of liquidity for all the stocks
4. We also calculated the Turnover ratio (defined as total volume traded/number of outstanding shares).

Now let us turn to our findings in a quest to answer our questions:
Table 1- % change between Pre-crisis (2003-2008) and Post crisis (2009-2013) 
1. By how much did the liquidity drop for key index movers measured in terms of before and after Global Financial Crisis?

Regarding the first question liquidity dropped across the board in the aftermath of the crisis as expected. For example SABIC’s daily average value traded (ADVT) stood at  USD 178 mn dollars during the period from 2003-2008. Post 2008 the ADVT fell by 27% to USD 130 mn dollars. Saudi Telecom saw a large decline in ADVT from USD 100 mn before the crisis to USD 11.9 mn a drop of almost 90%. The table above shows the effects of the crisis on the average value traded.

Table 2- Summary of finding


2. What impact such a drop had on the bid-ask spread (a proxy to measure transaction cost)
In general, as liquidity improves, bid-ask spread reduces thereby reducing the cost of transaction. In the case of heavy weight GCC stocks, spreads increased in response to a fall in the liquidity for most of them. SABIC’s  Spread was 0.23% prior to the financial crisis while after the crisis it increased to 0.3%. In the case of Saudi Telecom the Spread increased marginally from 0.27% to 0.29%. The biggest increase in spreads is seen in Zain where before the crisis the spread was around 0.75% (high compared to Saudi companies) while after the crisis it increased by  88% to 1.42% though this cannot be totally attributed to a fall in ADVT as ADVT declined only by 9% compared to pre-crisis numbers

3. Are there any inconsistencies in this and if so what can explain it?
Finally were there any inconsistencies? Some companies in our study showed positive correlation in that while liquidity decreased, the bid-ask spread also decreased and vice versa. Examples include Emaar, First Gulf Bank and industries Qatar. However the main reason behind this positive correlation is that the mentioned companies did not have sufficient history for us to make meaningful comparison between pre-crisis and post crisis numbers. The only company with sufficient data was SAMBA and we could attribute the fall in liquidity to the financial crisis and attribute the fall in spread to peers. In other words, before the crisis SAMBA had the highest spread among Saudi banks under our coverage thus the number after the crisis had to drop to be in line with other Saudi banks.


Concluding Thoughts:Leading GCC stocks today have more bid-ask spread than a few years before thanks to poor liquidity. The bid-ask spread ranges from a low of 0.18% (Industries Qatar) to 1.52% (National Bank of Kuwait). Going forward, as liquidity improves, the bid-ask spread should reduce and may reach levels seen before the financial crisis. Market attractiveness to institutional investors can be significantly increased if liquidity improves and reduces the bid-ask spread.


By -  M.R. Raghu & Humoud Al Sabah